
When evaluating flat panel displays (FPDs), view angle performance is one of the most critical parameters that determines how consistent the display’s brightness, color, and contrast appear from different viewing positions. Imagine a smartphone screen that looks perfect when held straight in front of you but loses brightness, color accuracy, and contrast as soon as you tilt it — this is a display with poor view angle performance.
In industries producing LCDs, OLEDs, and other flat panel displays, engineers and QA specialists need precise tools to measure these changes. This article explores how conoscope lenses revolutionize view angle testing, outperform traditional goniometric systems, and ensure accurate, cost-effective quality control.
What Is View Angle Performance?
View angle performance refers to a display’s ability to maintain consistent luminance, contrast, and color fidelity when viewed from various angles. The viewing cone is a concept used to describe the angular range over which the display maintains acceptable visual performance .
Key Display Parameters to Track
-
Luminance: The intensity of light emitted per unit area, critical for visibility and readability.
-
Contrast: The ratio between the brightest and darkest parts of the display, affecting image clarity.
-
Chromaticity: The color characteristics of a display, typically measured using CIE color coordinates, which determine how accurate the colors appear at different angles.
Monitoring these parameters across the viewing cone is essential for ensuring displays meet consumer expectations and industry standards.
Conoscope Lenses vs. Traditional Goniometric Systems
Traditional goniometric systems use a rotating arm with a photometer or camera to measure display performance angle by angle. While accurate, these systems are time-consuming and labor-intensive, especially when testing multiple displays on production lines.
Single-Shot Angular Measurement Benefits
Conoscope lenses provide a single-shot angular measurement, capturing all angles simultaneously. This approach offers several advantages:
-
Speed: Captures the complete view angle data in one acquisition, significantly reducing testing time.
-
Efficiency: Eliminates the need for repetitive mechanical movements, reducing wear and tear.
-
Cost-Effectiveness: Minimizes labor and increases throughput, especially important for high-volume production.
By replacing slow, traditional systems, conoscope lenses make angular characterization practical for both R&D and in-line QA.
How Conoscope Lenses Work in View Angle Testing
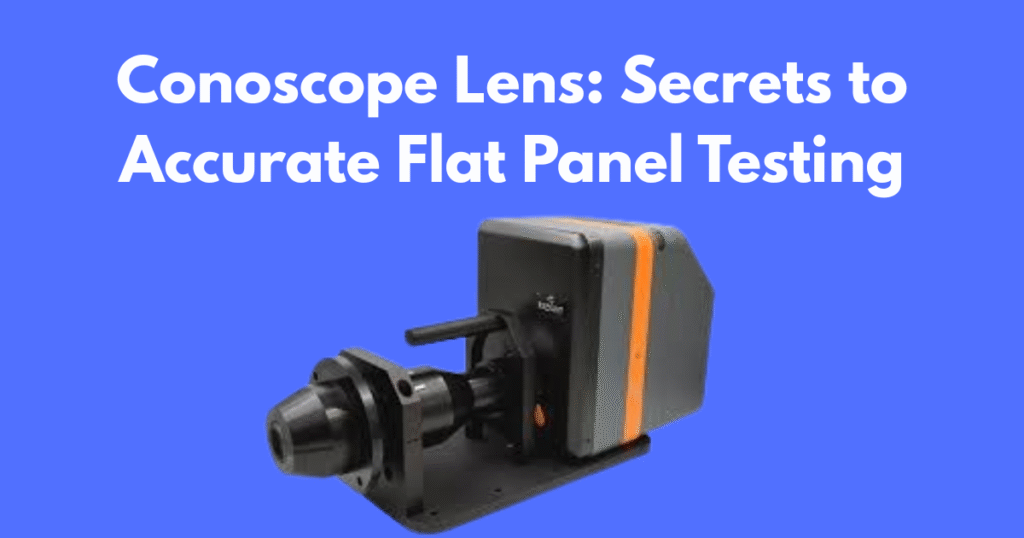
Conoscope lenses use principles of Fourier optics to transform the angular distribution of light emitted from a display into a spatial image on a sensor. Essentially, the lens maps each viewing angle to a specific location on the camera sensor, producing a complete angular profile in a single shot.
Mapping Angles to Sensor Images
-
Each pixel on the sensor corresponds to a specific emission angle from the display.
-
Software then reconstructs the luminance and color distribution across the viewing cone.
-
This method allows engineers to generate polar plots, heatmaps, and 3D visualizations that illustrate how the display behaves across all angles.
Real-World Applications in LCD and OLED Displays
Conoscope lenses are widely used in both laboratory R&D and in-line production environments:
1. R&D Characterization
-
Engineers use conoscope lenses to evaluate prototypes, optimize materials, and tweak display architectures.
-
It allows for rapid comparison of different panel technologies, such as IPS, OLED, or AMOLED, for angular performance.
2. In-Line Quality Assurance
-
High-volume manufacturers integrate conoscope lenses into production lines to quickly identify panels that fail luminance or color uniformity tests.
-
By automating view angle measurements, factories can maintain consistent quality standards without slowing production.
Measurement Metrics to Track
For comprehensive view angle testing, several metrics should be measured and analyzed:
-
Luminance Distribution: Ensures that the display brightness remains within acceptable limits across all viewing angles.
-
Chromaticity Coordinates: Tracks color shifts at different angles to ensure color consistency.
-
Angular Contrast: Evaluates how contrast ratios degrade at oblique angles, critical for displays in high ambient light conditions.
Accurate measurement of these parameters helps manufacturers improve panel design, ensure user satisfaction, and reduce return rates.
Common Setup and Calibration Tips
To achieve reliable results with conoscope lenses, follow these best practices:
-
Calibration: Regularly calibrate the lens with a reference light source to maintain measurement accuracy.
-
Alignment: Ensure the lens is correctly aligned with the display plane to prevent angular distortion.
-
Environment Control: Minimize ambient light interference by performing tests in a controlled lighting environment.
-
Software Configuration: Use manufacturer-recommended software settings for angle mapping, color correction, and data visualization.
Pro Tip: Document your calibration procedure and include a checklist for in-line operators to maintain consistency across shifts.
Conclusion
Understanding view angle performance is crucial for designing and manufacturing high-quality flat panel displays. Conoscope lenses offer a fast, accurate, and cost-effective solution for measuring luminance, contrast, and chromaticity across the entire viewing cone. By leveraging these lenses, engineers can optimize display design in R&D and maintain rigorous in-line quality assurance.
If you’re involved in LCD or OLED production, integrating conoscope lens testing into your workflow can dramatically improve product reliability and customer satisfaction. Start by calibrating your lens, following best practices, and systematically tracking angular metrics.