
TL;DR
Conoscope optics are lens systems that convert the direction of light into position on a sensor. One exposure then shows how a source changes with viewing angle. They are widely used to test displays, AR/VR devices and LIDAR. This guide covers the principle, the specifications that matter, how conoscope optics compare with goniometers, and the mistakes to avoid.
Quick Answer
Conoscope optics are a lens system, usually built around a Fourier-type front lens, that maps each emission angle from a small measurement spot to a specific point on an image sensor. A single exposure records luminance and color across a wide range of viewing angles. Engineers use conoscope optics to measure displays, near-eye devices and light sources faster than scanning with a goniometer.
Introduction
Ask how bright a phone screen is and you will usually get one number. That number is only true from one direction. Tilt the phone and the brightness drops, the color shifts and the contrast changes.
For a product team, that change is the whole story. A television has to look good from the sofa and from the side of the room. A car display must stay readable for both driver and passenger. An AR headset has to deliver a clean image to a pupil that moves slightly.
Measuring all of those directions one at a time is slow. Conoscope optics solve this by capturing the angular behavior of a light source in a single image.
This guide explains what conoscope optics are, how the optical principle works and what the main specifications mean. You will also see where the technology fits best, how it compares with other methods and what to ask before you buy or build a system.
What Are Conoscope Optics?
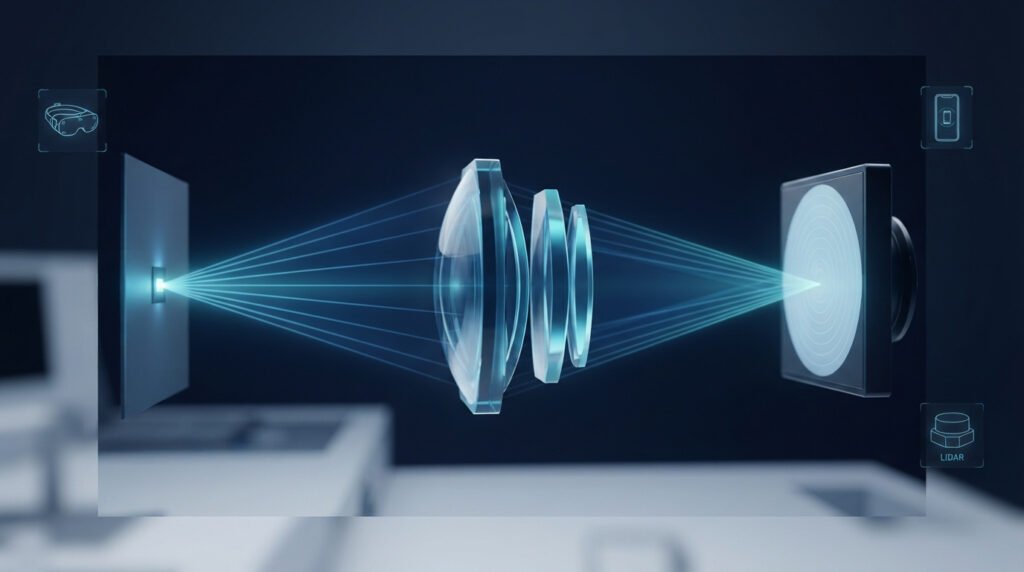
Conoscope optics are an imaging system designed to record the angular distribution of light, not a picture of an object. The system looks at a small spot on a source, such as part of a display. It sorts the light leaving that spot by direction and records the result on a camera sensor.
The word comes from conoscopy, an older technique from polarized-light microscopy. Mineralogists used it to look at crystals in a cone of converging light, often with an extra lens that reveals the pattern of directions. Modern metrology borrowed the idea and applied it to displays and light sources.
You will meet several related terms. “Conoscopic lens,” “conoscope lens” and “Fourier lens” are used almost interchangeably. In practice, conoscope optics describe the whole optical train, which includes the front lens, relay optics, apertures and filters, not just a single glass element.
The Core Idea: Turning Angle Into Position
A normal camera lens makes an image of a scene. Every point on the sensor corresponds to a point on the object.
Conoscope optics work differently. They place the measurement spot at the front focal plane of a lens. Rays that leave the spot in the same direction come together at the same point on the back focal plane, no matter where on the spot they started.
The result is a map of directions. Position on the sensor now means angle of emission. The center of the image represents light traveling straight ahead, and rings around it represent increasing angles.
For an ideal Fourier lens, the distance from the center is proportional to the sine of the emission angle. Real conoscope optics approximate this relationship and are calibrated so that each pixel can be converted to a precise angle.
Why the Image Looks Like a Fisheye View
If you open a raw conoscopic image, it can look like a fisheye photograph, a circular picture with strong distortion. That is expected. The system is not trying to show shapes, so the distortion is simply the angle-to-position mapping at work.
What you see are bright and dark regions arranged by direction. A display with narrow viewing angles shows a bright core that fades toward the edge. A display with a wide viewing angle shows a broader, flatter pattern.
The Directions Image and the Object Image
A complete system usually produces two kinds of image. The first is the directions image described above. The second is an image of the measurement spot itself, formed by adding a second lens.
The second image matters in practice. It lets the operator see exactly which part of the sample is being measured, so the angular data can be tied to a known location.
Anatomy of a Conoscope Optical System
Designs vary, but most conoscope optics share the same building blocks.
The front Fourier lens
The front lens group does the main job of converting direction to position. It has a large acceptance angle, and it must keep the entrance pupil well controlled so that each direction is sampled consistently.
This is the hardest part to make. Wide angles push the lens toward strong curvature and many elements, and every element adds the possibility of reflections and aberrations.
Relay lens and field stop
A relay group carries the directions image to the sensor, often with a magnification suited to the sensor size. A field stop, or aperture, defines the measurement spot by blocking light from outside the area of interest.
Careful aperture placement keeps neighboring areas of a display from leaking into the measurement. This matters when you measure a single pixel structure or a small test pattern.
Sensor and camera
The sensor records the directions image. Most systems use a calibrated scientific camera with good linearity and low noise. Sensor size interacts with the lens design, as the next section explains.
Filters and polarization elements
Many setups add color filters or a set of tristimulus filters to measure color coordinates. Some include a polarizer to study polarization behavior. Whatever is added becomes part of the optical path and must be included in calibration.
Why Étendue Limits What Conoscope Optics Can Do
A useful way to understand the design limits is étendue, sometimes discussed as the Lagrange invariant. It is a conserved quantity that links the size of the measurement area, the range of angles accepted and the size of the image.
In plain terms, you cannot have everything at once. Once you choose the spot size and the angular range, the sensor size and the lens speed are tied together. A wide angle, a large spot and a small sensor cannot all coexist in one design.
This trade-off explains why different conoscope optics exist for different jobs. A system built for a small AR display looks at a tiny spot with a small pupil. A system built for a television examines a larger area with a different balance.
When a supplier says a design can do “everything,” this physical limit is a good reason to ask more questions.
Key Specifications of Conoscope Optics
Datasheets list many numbers. These are the ones that most affect real measurement quality.
Angular range
This is the span of emission angles the system captures, often stated as a half-angle around the axis. A lens that covers ±60°, for example, records light up to 60 degrees from straight ahead on every side.
A wider range is not always better. It increases design complexity and can lower accuracy at the edges. Match the range to your device. A narrow-view privacy display and a wide-view television need quite different coverage.
Angular resolution and mapping accuracy
Resolution tells you how finely angles are separated on the sensor, usually in degrees per pixel. Mapping accuracy tells you how closely each pixel’s angle matches the true angle.
Both depend on the lens, the sensor and the calibration. Ask for the measured mapping error across the field, not just the nominal resolution.
Measurement spot size and working distance
The spot size is the diameter of the area measured on the sample. The working distance is the gap between the front of the lens and the sample.
For flat panels, a small spot lets you sample uniformity across the screen. For curved or recessed devices, a longer working distance may be needed to avoid mechanical collisions.
Entrance pupil and pupil aberration
The entrance pupil defines where rays are collected. A well-corrected design keeps its pupil position stable across angles, so the same part of the sample is measured at every direction.
If the pupil shifts with angle, you effectively measure slightly different areas at different angles. This introduces errors that can look like a real property of the device.
Distortion and image quality
Because the mapping is intentionally non-linear, “distortion” here means deviation from the intended angle-to-position relationship. Good conoscope optics keep this deviation small and well characterized, so it can be corrected in software.
Image sharpness still matters. Blur in the directions image smears neighboring angles together, which hides fine features such as sharp cutoffs.
Stray light and ghost control
Bright sources make this the most underestimated factor. Internal reflections inside the lens can place faint ghost images in the directions image, which add to the true signal.
Anti-reflection coatings, baffles and careful mechanical design reduce these effects. Ask how stray light was evaluated, and whether the supplier can show a test on a high-contrast source.
Spectral range and transmission
Most display work is in the visible range, but some applications, such as LIDAR, use near-infrared wavelengths. Make sure the lens glass, coatings and sensor suit the wavelengths you need.
Polarization behavior
Display light is often polarized. If the optics treat polarization states differently, the measured luminance can vary with the state of the light. This should be understood and, if needed, corrected during calibration.
Where Conoscope Optics Are Used
Flat-panel displays
Liquid crystal and OLED panels change in brightness and color as the viewing angle grows. Conoscope optics record this behavior in one capture, which helps teams compare designs, check uniformity and verify specifications.
The data supports measures such as viewing-angle limits, color shift and contrast across angle.
AR, VR and near-eye displays
Near-eye devices place a small virtual image close to the eye. Testing them means mimicking the eye’s position and pupil size, which calls for a small entrance pupil.
Two practical points stand out. The lens must often focus at different virtual image distances without changing the size of the image, which is why variable-conjugate or varifocal designs are used. The physical size of the lens front also matters, because it may need to fit within the spacing between the eyes if both are tested together.
Automotive displays and LIDAR
In-vehicle displays and head-up displays have to stay readable from fixed seating positions, so angular behavior is central. Conoscope optics also appear in LIDAR testing, where engineers check that the transmitter and receiver angles line up as intended.
LEDs, backlights and optical films
Light sources and films shape light on purpose. A conoscope shows the resulting angular pattern in one frame, which supports design checks and quality control.
Crystal and polarization studies
The original use is still alive in mineralogy and materials science. Observing a crystal in converging light reveals patterns that relate to its optical properties.
Conoscope Optics vs Goniometers and Other Methods
A goniometer measures angular distribution by mechanically moving a detector or the sample, one angle at a time. It is a proven and flexible method, but it takes longer.
| Method | How it works | Strengths | Limits |
|---|---|---|---|
| Conoscope optics | Maps angles to sensor pixels in one exposure | Fast, dense angular data | Angular range fixed by the lens, stray light sensitivity |
| Goniometer | Mechanically scans a detector across angles | Flexible range, high-accuracy detectors | Slow, mechanical wear |
| Fixed multi-detector rig | Several detectors at set angles | Quick for a few angles | Sparse angular sampling |
Neither approach replaces the other in every case. Many labs use conoscope optics for speed and detail, and keep a goniometer as a reference for validation.
A sensible way to decide is to ask how many angles you need and how often you measure. For production lines and rapid design iteration, a single-shot approach saves time. For rare, highly specialized measurements, a scanning method may be simpler.
How a Measurement Works in Practice
A typical workflow looks like this.
First, the device is positioned so the measurement spot sits where you want it. The object image from the second lens helps confirm this.
Second, the lens is focused and the spot size is set with the aperture. For near-eye devices, the focus is adjusted to the intended virtual image distance.
Third, the system is calibrated. Angular calibration links each pixel to a true angle, often using a known reference. Radiometric calibration links pixel values to luminance, and color calibration handles the filters.
Fourth, the camera captures the directions image, usually with background frames subtracted to remove sensor offset.
Finally, software converts the image into angular plots, such as luminance versus angle or color coordinates versus angle.
None of these steps is difficult, but skipping calibration undermines everything that follows. The quality of the result depends as much on the process as on the hardware.
Common Mistakes When Using Conoscope Optics
Most disappointing results trace back to a short list of errors.
One is choosing the angular range first and ignoring the spot size. As the étendue discussion showed, the two are linked, so a wide angle can force a smaller spot or a larger sensor.
Another is trusting the nominal spec instead of the measured performance. Ask for mapping accuracy and stray light data on the actual unit.
A third is ignoring stray light when measuring very bright or very high-contrast sources. A faint ghost can masquerade as a real feature.
A fourth is poor alignment. If the sample is tilted or off-center, the whole angular map shifts. Use a fixture that repeats well.
A fifth is forgetting polarization and wavelength. Two instruments can disagree simply because one treats polarized light differently.
Finally, many teams overlook the effect of the sample itself. Heat, uneven drive conditions or a warm-up period can change the display during the measurement.
How to Choose Conoscope Optics for Your Application
Start with the device, not the catalog. Write down what you need to measure and under what conditions.
Define the measurement task
State the type of source and the size of the area you need to sample. For displays, specify the viewing range that matters to the customer. For near-eye devices, note the pupil size and virtual image distances.
Match the optics to the sensor
Because of étendue, the lens and camera must be chosen together. A supplier who proposes a lens without asking about your sensor or spot size may not be considering this link.
Ask for evidence
Request data on mapping accuracy, image sharpness and stray light for the model you will receive. A short demonstration on your own sample is worth more than a polished brochure.
Consider customization
Standard systems cover many cases, but unusual working distances, wavelengths or mechanical envelopes sometimes require a custom design. Discuss tolerances and lead time early.
Look at support
Calibration certificates, software compatibility and service access decide how smoothly the system runs a year from now. Ask what happens if the lens needs recalibration.
Care and Handling
Treat conoscope optics as precision equipment. Keep the front element clean and covered when not in use, and clean it only with methods the manufacturer recommends, since coatings can be delicate.
Mount the system on a stable fixture and avoid sudden temperature changes, which can shift focus and calibration. Record the setup after each calibration so you can detect drift over time.
If measurements start to look inconsistent, check alignment, cleanliness and calibration status before suspecting the device under test.
Conclusion
Conoscope optics give engineers a fast, detailed view of how light leaves a source across angle. The core idea is simple: turn direction into position, then read the result from an image.
The practical choices are where quality is decided. Spot size, angular range, sensor and stray light control all pull on one another, so they have to be considered together. Calibration and good measurement habits matter as much as the lens.
If you are evaluating a system, begin with a clear description of your device and your target specifications. Ask for measured data, test on your own samples, and keep a reference method in reserve for validation. With that approach, conoscope optics can shorten development cycles and give you data you can rely on.
Frequently Asked Questions
What are conoscope optics used for?
Conoscope optics measure how brightness, color and contrast change with viewing angle. They are used to test displays, AR/VR devices, automotive screens, LIDAR systems and light sources, because one exposure captures a wide range of angles at once.
How do conoscope optics differ from a camera lens?
A camera lens forms an image of an object, so each sensor point matches a point in the scene. Conoscope optics map emission angles to sensor positions, so each point on the sensor matches a direction of light instead.
Why does a conoscopic image look distorted?
The distortion is intentional. The system arranges light by angle, which produces a fisheye-like picture. The pattern is converted into angular data during calibration.
Can conoscope optics replace a goniometer?
Often for speed and detail, yes, but not always. A goniometer offers flexible angular range and is often kept as a reference, so many labs use both.
What limits the angular range of conoscope optics?
Étendue ties together the spot size, the angular range and the sensor size. Increasing one usually requires giving up something else, which is why designs are tailored to specific applications.